

Currently Empty: ر.ق 0,00


IELTS
IELTS Writing Task 1 Table Questions: How to Select and Compare Data
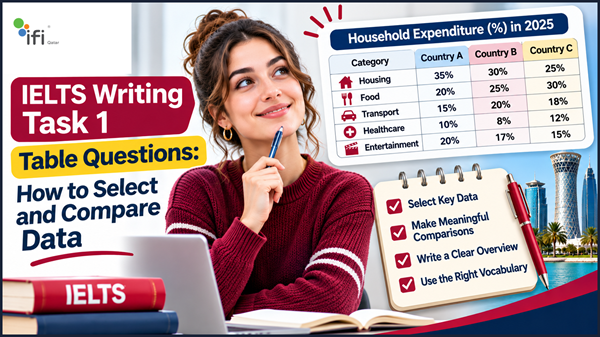
IELTS Writing Task 1 table questions may look straightforward because they present information in rows and columns. However, describing a table accurately requires more than copying numbers or listing every figure. You need to identify the most important information, recognise meaningful differences and organise the data into a clear, well-written report.
Many candidates lose valuable marks because they try to describe every number instead of selecting the figures that best represent the main features. Others use repetitive language, overlook important comparisons or write an introduction without a clear overview.
The key to answering an IELTS table question successfully is knowing what to include, what to compare and how to present the information logically.
In this guide, you will learn how to approach IELTS table chart Task 1 questions, identify key figures, make effective comparisons and use appropriate vocabulary. You will also find a complete sample question, a model answer, practical exercises and strategies to improve your Writing performance.
What Is an IELTS Writing Task 1 Table Question?
An IELTS Writing Task 1 table question presents numerical or categorical information in rows and columns. Your task is to summarise the information in your own words, highlight the main features and make relevant comparisons.
Tables may present information about:
- Population statistics.
- Employment rates.
- Educational performance.
- Household spending.
- Business revenue.
- Transportation.
- Tourism.
- Consumer behaviour.
- Production figures.
- Changes in different countries or age groups.
For example, a table might compare the percentage of people using different forms of transport in four countries. Another might show the average monthly expenditure of households on food, housing and transportation.
Your job is not to explain why these figures are different. Instead, you should report what the data shows and highlight the most significant patterns.
Is Table Chart Task 1 Part of IELTS Academic or General Training?
Table questions are part of IELTS Academic Writing Task 1.
In the Academic test, candidates describe visual information such as tables, bar charts, line graphs, pie charts, maps and process diagrams.
In IELTS General Training Writing Task 1, candidates write a letter rather than describe a table or chart.
The Academic Writing test contains two tasks. Task 1 requires at least 150 words, and candidates are generally advised to spend around 20 minutes on it.
How to Understand an IELTS Table Before Writing
Before you start writing, spend a few minutes understanding the information presented in the table.
A common mistake is to begin writing immediately after reading the title. This can lead to inaccurate comparisons and an unclear report.
Instead, examine the table systematically.
1. Read the Table Title
The title usually tells you what the table measures.
For example:
Average Monthly Household Expenditure in Three Countries in 2024
From this title, you can identify:
- The subject: household expenditure.
- The measurement: average monthly spending.
- The groups: three countries.
- The time reference: 2024.
Understanding these details helps you avoid describing the data incorrectly.
2. Check the Units of Measurement
Always identify how the information is measured.
A table may present:
- Percentages.
- Numbers of people.
- Thousands or millions.
- Currency values.
- Hours.
- Annual or monthly averages.
- Rates per 1,000 people.
For example, there is a significant difference between describing a figure as 25% and describing it as 25,000 people.
Pay attention to symbols such as %, $, £ and QAR, as well as words such as average, total and per capita.
3. Identify the Categories
Look at the rows and columns to understand what is being compared.
The table might compare:
- Different countries.
- Several age groups.
- Multiple years.
- Different industries.
- Categories of expenditure.
- Types of transport.
Identify the categories before selecting any figures.
4. Look for the Most Important Figures
You do not need to mention every number in the table.
Instead, identify the figures that reveal the most important patterns.
Look for:
- The highest value.
- The lowest value.
- The largest difference.
- The smallest difference.
- Similar results between categories.
- Noticeable increases or decreases.
- Significant exceptions.
- Consistent patterns across groups.
These observations will help you develop a meaningful overview and organise the body paragraphs.
How to Select the Most Important Data in IELTS Table Chart Task 1
Selecting relevant information is one of the most important skills in Academic Writing Task 1.
The examiner is not looking for a mechanical list of figures. Your response should demonstrate that you can identify key features and support them with accurate data.
Focus on the Highest and Lowest Figures
The highest and lowest values are often useful starting points.
Consider this example:
| Country | Public Transport | Private Cars | Cycling |
|---|---|---|---|
| Country A | 55% | 30% | 15% |
| Country B | 25% | 60% | 15% |
| Country C | 40% | 35% | 25% |
| Country D | 20% | 50% | 30% |
Several important observations can be made:
- Public transport is most popular in Country A, at 55%.
- Private cars account for the largest share in Country B, at 60%.
- Cycling reaches its highest figure in Country D, at 30%.
- Public transport is least popular in Country D, at 20%.
These comparisons provide useful material for your report.
Identify Significant Differences
Do not simply report the highest and lowest figures. Consider how much they differ.
For example:
- Country A has a public transport figure of 55%.
- Country D has a public transport figure of 20%.
The difference is 35 percentage points.
You could write:
“Public transport usage was considerably higher in Country A than in Country D, at 55% and 20% respectively.”
This sentence communicates the comparison clearly without unnecessary explanation.
Remember that when comparing percentages, a difference between 55% and 20% is 35 percentage points, not necessarily a 35% difference.
Group Similar Figures Together
Sometimes the most important feature is not the highest or lowest value but the similarity between categories.
For example, in the table above:
- Cycling accounts for 15% in both Countries A and B.
- Private car usage is relatively similar in Countries A and C, at 30% and 35%.
You can group these figures in the same sentence or paragraph.
This makes your writing more concise and prevents repetitive descriptions.
Look for Exceptions
An exception is a result that differs noticeably from the general pattern.
For example, public transport may be the most popular option in most countries, while private cars dominate in one country.
Identifying this exception can make your overview more informative.
However, make sure the exception is genuinely significant rather than focusing on a minor numerical difference.
How to Write an Effective Overview for an IELTS Table Question
The overview is one of the most important parts of your IELTS Academic Writing Task 1 response.
It summarises the main characteristics of the table without describing every individual figure.
A strong overview helps the examiner understand the overall picture before reading the supporting details.
What Should You Include in an Overview?
Depending on the table, your overview may highlight:
- The highest and lowest categories.
- The most noticeable differences.
- The dominant category.
- General similarities between groups.
- The most significant changes over time.
- An important exception.
For example, consider the transport table above.
A suitable overview could be:
“Overall, public transport was the most popular option in Country A, whereas private cars dominated in Country B. Cycling accounted for the largest share in Country D, although it represented the smallest proportion in the other two countries.”
This overview identifies the most important patterns without listing every number.
What Should You Avoid in an Overview?
Avoid these common problems:
Including too many figures: The overview should communicate the main picture, not reproduce the table.
Repeating the introduction: Simply restating the table title does not provide a meaningful summary.
Describing minor details: Focus on the most noticeable features rather than small differences that do not contribute to the overall picture.
Adding personal opinions: You should report the data, not explain whether the results are good, bad or surprising.
Inventing explanations: If the table does not explain why a figure is high or low, do not speculate about the reasons.
How to Compare Data in IELTS Writing Task 1
Comparison is essential when describing a table because it allows you to communicate relationships between figures instead of presenting isolated numbers.
The most effective comparisons are accurate, relevant and supported by specific data.
1. Compare the Highest and Lowest Values
Use this approach when two categories show a clear difference.
Example:
“The highest figure was recorded in Country A, at 55%, compared with just 20% in Country D.”
2. Compare Similar Categories
When two or more values are close, you can group them together.
Example:
“Private car usage was relatively similar in Countries A and C, accounting for 30% and 35% respectively.”
3. Compare Categories Within the Same Group
You can compare different categories within one country or population group.
Example:
“In Country B, private cars were the dominant form of transport, representing 60%, while cycling accounted for only 15%.”
4. Compare the Same Category Across Different Groups
This is useful when the table compares several countries, age groups or industries.
Example:
“Public transport usage ranged from 20% in Country D to 55% in Country A.”
5. Highlight Changes Over Time
Some tables present data from several years.
In this situation, identify whether values increased, decreased or remained stable.
Example:
“The proportion of households using public transport increased from 35% in 2015 to 48% in 2025.”
If the figures show no consistent direction, describe the fluctuations accurately rather than forcing a trend.
Essential Vocabulary for IELTS Table Chart Task 1
Using appropriate vocabulary helps you describe figures and comparisons more precisely.
However, you should prioritise accuracy over using complicated words unnecessarily.
Vocabulary for Introducing Figures
| Expression | Example |
|---|---|
| Accounted for | Public transport accounted for 45% of journeys. |
| Represented | This category represented 30% of the total. |
| Stood at | The figure stood at 65 in 2024. |
| Recorded | Country A recorded the highest value. |
| Reached | The percentage reached 70%. |
| Constituted | Food constituted the largest share of expenditure. |
| Made up | Private cars made up half of all journeys. |
Vocabulary for Comparing Figures
| Expression | Example |
|---|---|
| Higher than | The figure was higher than that of Country B. |
| Lower than | Spending was lower than in the previous year. |
| Compared with | Sales reached 500 units, compared with 350 in 2023. |
| Whereas | Country A recorded 60%, whereas Country B had 35%. |
| In contrast | In contrast, the lowest figure was recorded in Country D. |
| Respectively | The figures were 40% and 55%, respectively. |
| Similar to | The result was similar to that of the previous year. |
| Twice as high as | The figure was twice as high as the corresponding value. |
Vocabulary for Describing Differences
| Expression | Meaning |
|---|---|
| Significantly higher | A noticeably greater value |
| Slightly lower | A small reduction in comparison |
| Considerably greater | A substantial difference |
| Marginally higher | A very small increase |
| Almost identical | Two values that are very close |
| The largest gap | The greatest difference between two figures |
| The smallest proportion | The lowest percentage or share |
Vocabulary for Changes Over Time
If your table contains data from multiple years, these expressions may be useful:
- Increased gradually.
- Rose steadily.
- Declined slightly.
- Fell considerably.
- Remained relatively stable.
- Fluctuated over the period.
- Experienced a significant rise.
- Reached a peak.
- Dropped to its lowest point.
Choose verbs that accurately reflect the figures. Do not describe a small increase as dramatic or a stable figure as a downward trend.
How to Structure an IELTS Writing Task 1 Table Answer
A clear structure makes your response easier to follow and helps you present the information logically.
A practical approach is to use four paragraphs.
Paragraph 1: Introduction
Paraphrase the question by explaining what the table shows.
Avoid copying the question word for word.
For example:
“The table compares the proportions of people using three forms of transport in four different countries.”
Paragraph 2: Overview
Summarise the most important features.
For example:
“Overall, public transport was the dominant option in Country A, while private cars were most popular in Country B. Cycling accounted for the largest share in Country D.”
Paragraph 3: Main Comparisons
Present the first group of important figures.
You might compare:
- Countries A and B.
- The highest and lowest values.
- Categories with similar results.
Paragraph 4: Additional Comparisons
Describe the remaining important figures and highlight any relevant differences or exceptions.
Avoid adding a personal conclusion. IELTS Academic Task 1 requires an objective summary, not an argument or opinion.
IELTS Table Chart Task 1 Sample Question and Model Answer
The best way to understand how these strategies work is to examine a complete example.
Sample IELTS Writing Task 1 Question
The table below shows the percentage of monthly household expenditure allocated to five categories in three countries in 2025.
Summarise the information by selecting and reporting the main features, and make comparisons where relevant.
Sample Data:
| Expenditure Category | Country A | Country B | Country C |
|---|---|---|---|
| Housing | 35% | 30% | 25% |
| Food | 20% | 25% | 30% |
| Transport | 15% | 20% | 18% |
| Healthcare | 10% | 8% | 12% |
| Entertainment | 20% | 17% | 15% |
Step 1: Identify the Key Features
Before writing, identify the most important observations.
Highest figures:
- Housing in Country A: 35%.
- Food in Country C: 30%.
- Transport in Country B: 20%.
- Healthcare in Country C: 12%.
- Entertainment in Country A: 20%.
Lowest figures:
- Housing in Country C: 25%.
- Food in Country A: 20%.
- Transport in Country A: 15%.
- Healthcare in Country B: 8%.
- Entertainment in Country C: 15%.
Overall patterns:
- Housing represents the largest expenditure category in Country A and Country B.
- Food accounts for the largest share in Country C.
- Healthcare represents the smallest proportion in all three countries.
- Entertainment spending decreases from Country A to Country C.
These observations give you enough material to write a focused report.
Step 2: Write the Introduction
“The table compares the percentages of monthly household spending allocated to five expenditure categories in three countries in 2025.”
This sentence paraphrases the question and introduces the subject clearly.
Step 3: Write the Overview
“Overall, housing accounted for the largest share of household expenditure in Countries A and B, whereas food was the main expense in Country C. Healthcare represented the smallest proportion of spending in all three countries.”
This highlights the main patterns without unnecessary figures.
Step 4: Organise the Supporting Details
You can group the figures logically.
One paragraph can compare housing and food, while another can describe transport, healthcare and entertainment.
This approach helps avoid describing the table row by row without a clear structure.
Complete Model Answer
The table compares the percentages of monthly household spending allocated to five expenditure categories in three countries in 2025.
Overall, housing accounted for the largest share of household expenditure in Countries A and B, whereas food was the main expense in Country C. Healthcare represented the smallest proportion of spending in all three countries.
In Country A, housing accounted for 35% of monthly expenditure, compared with 30% in Country B and 25% in Country C. By contrast, spending on food increased across the three countries, rising from 20% in Country A to 25% in Country B and reaching 30% in Country C. This made food the largest expenditure category in Country C.
Regarding the remaining categories, transport accounted for 15% of spending in Country A, compared with 20% in Country B and 18% in Country C. Healthcare received the smallest share in every country, at 10%, 8% and 12%, respectively. Entertainment expenditure was highest in Country A, at 20%, before declining to 17% in Country B and 15% in Country C.
Why Is This Model Answer Effective?
The response demonstrates several useful techniques.
A clear introduction: The first sentence identifies the subject, measurement and groups being compared.
A meaningful overview: The second paragraph highlights the dominant expenditure categories and the smallest category.
Logical grouping: Housing and food are discussed together, followed by the remaining categories.
Relevant figures: The response uses numbers to support comparisons rather than listing every value independently.
Accurate language: Expressions such as compared with, whereas, rising from and respectively help communicate relationships between the figures.
Objective reporting: The answer describes the information without introducing unsupported explanations or personal opinions.
The sample is a practice model, not an official IELTS band score. A reliable assessment requires consideration of all four Writing criteria.
Common Mistakes in IELTS Table Chart Task 1
Understanding common mistakes can help you improve the accuracy and organisation of your response.
1. Describing Every Number
Some candidates believe they must mention every figure in the table.
This often produces a long, repetitive report without a clear overview.
How to improve: Select the most significant figures and group related information into meaningful comparisons.
2. Writing an Overview Without Identifying the Main Features
An overview that simply says “There were several differences between the countries” is too general.
How to improve: Identify the dominant category, highest or lowest values, and any noticeable patterns.
3. Comparing Figures Incorrectly
Incorrect comparisons can damage the accuracy of your report.
For example, saying that 60% is 20% higher than 40% confuses a percentage-point difference with a relative percentage increase.
How to improve: Use “20 percentage points higher” when comparing 60% with 40%. If you want to describe a relative increase, calculate it accurately.
4. Repeating the Same Vocabulary
Using “the figure was” in every sentence can make your writing repetitive.
How to improve: Use a natural range of expressions such as accounted for, represented, stood at and recorded, where appropriate.
5. Adding Personal Opinions
IELTS Academic Task 1 is a data-reporting task, not an opinion essay.
Avoid statements such as:
“I believe Country A spends too much money on housing.”
How to improve: Report what the table shows without judging the figures.
6. Inventing Reasons for the Data
A table may show that one country spends more on transport than another, but it does not necessarily explain why.
How to improve: Do not introduce explanations unless the information is explicitly provided.
7. Forgetting Units
Reporting a figure without its unit can make your description unclear.
For example, 25 could mean 25%, 25 people or 25,000 units.
How to improve: Check the table title, headings and units before writing.
8. Using an Inappropriate Structure
A report without paragraphing can make comparisons difficult to follow.
How to improve: Use an introduction, overview and two organised detail paragraphs.
How to Manage Your Time in IELTS Table Questions
You generally have around 20 minutes for Academic Writing Task 1.
A simple time-management plan can help you complete the response without spending too long analysing the table.
| Stage | Suggested Time | What to Do |
|---|---|---|
| Analyse the table | 3 minutes | Identify categories, units and key figures |
| Plan comparisons | 2 minutes | Group information and select key features |
| Write the response | 12 minutes | Complete the introduction, overview and body paragraphs |
| Review | 3 minutes | Check grammar, spelling, figures and word count |
These are suggested timings rather than official IELTS rules.
Avoid spending too much time planning individual sentences. The purpose of the planning stage is to identify the main comparisons and establish a logical structure.
Remember that Task 2 carries greater weight than Task 1 in the overall Writing score, so it is important to manage your time across the full Writing test.
How to Improve Your IELTS Writing Task 1 Table Score
Improving your table description requires more than learning a list of academic vocabulary.
You need to develop the ability to analyse information, select relevant details and communicate comparisons accurately.
1. Practise Identifying Key Features
Take a table and spend one minute identifying:
- The highest figure.
- The lowest figure.
- The largest difference.
- The most similar values.
- Any important exceptions.
Then write an overview using only the main features.
This exercise develops your ability to summarise information rather than mechanically describe every number.
2. Build Your Data Comparison Vocabulary
Practise using expressions such as:
- Higher than.
- Lower than.
- Accounted for.
- Represented.
- Compared with.
- Whereas.
- Respectively.
- Almost identical.
- Significantly greater.
Use these expressions in complete sentences and check that they accurately describe the figures.
3. Practise Different Table Formats
Not all IELTS tables look the same.
You may encounter:
- Tables comparing different countries.
- Tables showing changes over time.
- Tables comparing age groups.
- Tables presenting several categories.
- Tables containing percentages and numerical values.
- Tables with multiple years and categories.
Practising different formats helps you become more flexible when analysing unfamiliar information.
4. Review Your Grammar and Sentence Structure
Data comparisons often require complex sentences.
For example:
“While housing accounted for 35% of expenditure in Country A, the corresponding figure in Country C was considerably lower, at 25%.”
Practise using:
- While and whereas.
- Although.
- Compared with.
- Respectively.
- Relative clauses.
- Comparative structures.
However, grammatical variety should never come at the expense of accuracy.
5. Get Your Writing Assessed
Writing Task 1 can be difficult to evaluate independently because identifying errors is not the same as understanding how they affect your performance.
A structured Writing assessment can help you identify weaknesses in:
- Task Achievement.
- Coherence and Cohesion.
- Lexical Resource.
- Grammatical Range and Accuracy.
For example, you may select the correct figures but fail to highlight the main features. Alternatively, your report may have a good structure but contain inaccurate comparisons or repetitive vocabulary.
A detailed assessment can help you understand what needs improvement and prioritise your preparation.
IELTS Writing Task 1 Table Practice Exercise
Use the following table to practise selecting and comparing information.
Practice Question:
The table below shows the percentage of employees working in four industries in three cities.
Summarise the information by selecting and reporting the main features, and make comparisons where relevant.
| Industry | City A | City B | City C |
|---|---|---|---|
| Technology | 35% | 25% | 40% |
| Healthcare | 20% | 30% | 25% |
| Education | 25% | 20% | 15% |
| Tourism | 20% | 25% | 20% |
Your Task
Before writing your report, answer these questions:
- Which industry has the highest percentage in City A?
- Which city has the highest proportion of employees working in technology?
- Which industry has the lowest percentage in City C?
- Which industry has the same percentage in Cities A and C?
- What is the most noticeable difference between the three cities?
Suggested Answers
- Technology, at 35%.
- City C, at 40%.
- Education, at 15%.
- Tourism, at 20%.
- Technology is the dominant industry in Cities A and C, while healthcare has the highest percentage in City B.
Practice Your Overview
Based on the table, a possible overview is:
“Overall, technology employed the largest proportion of workers in Cities A and C, whereas healthcare was the leading industry in City B. Education accounted for the smallest share in City C, while tourism represented an identical proportion in Cities A and C.”
Try writing your own complete response in approximately 150–190 words.
After finishing, check whether you have included an accurate overview, relevant comparisons and sufficient supporting figures.
Frequently Asked Questions About IELTS Table Chart Task 1
What is IELTS table chart Task 1?
IELTS table chart Task 1 is a question format in IELTS Academic Writing in which candidates describe numerical or categorical information presented in rows and columns. They must summarise the main features and make relevant comparisons using their own words.
How many words should I write for an IELTS table question?
You must write at least 150 words. Many candidates find that approximately 160–190 words provide enough space to describe the key features and support comparisons, although there is no official maximum word limit.
How do I start an IELTS Writing Task 1 table answer?
Start by paraphrasing the question. Mention what the table shows, the categories being compared and the relevant time period or measurement if provided.
Do I need an overview for IELTS table questions?
Yes. An overview is an important part of an effective Academic Task 1 response. It should highlight the main patterns, dominant categories, significant differences or other key features.
Should I describe every number in an IELTS table?
No. You should select the most important figures and use them to support your main comparisons. Describing every number can make your response repetitive and reduce the clarity of your report.
How can I compare data in IELTS Writing Task 1?
You can compare the highest and lowest figures, group similar values, identify significant differences and compare the same category across different groups. Use accurate comparative language and support your statements with relevant numbers.
What vocabulary should I use for IELTS table chart questions?
Useful expressions include accounted for, represented, stood at, compared with, whereas, respectively, higher than, lower than and almost identical. Choose vocabulary that accurately reflects the data.
Do I need a conclusion for IELTS Writing Task 1 tables?
No separate conclusion is required. Your response should include an introduction, an overview and paragraphs presenting the supporting details. The overview summarises the main features of the table.
Can I use my own opinion in an IELTS table description?
No. Academic Writing Task 1 requires an objective description of the information provided. You should not introduce personal opinions or invent explanations for the figures.
Are table questions included in IELTS General Training?
No. Tables and other visual data-description tasks are part of IELTS Academic Writing Task 1. General Training Task 1 requires candidates to write a letter.
What are the most common mistakes in IELTS table questions?
Common mistakes include describing every figure, missing the overview, making inaccurate comparisons, repeating vocabulary, ignoring units and adding unsupported explanations.
How can I improve my IELTS Writing Task 1 table score?
Practise selecting key features, writing clear overviews, comparing figures accurately and organising information into logical paragraphs. Getting your work assessed can also help identify weaknesses in task achievement, vocabulary, grammar and coherence.
Improve Your IELTS Writing Performance with IFI Qatar
IELTS table questions test your ability to understand numerical information and communicate it clearly. A strong response does not simply repeat the figures. It identifies the most important features, groups related information and makes accurate comparisons.
To improve, practise analysing different table formats, writing concise overviews and supporting your observations with relevant data. Pay particular attention to the accuracy of your comparisons, the organisation of your paragraphs and the range of language you use.
At IFI Qatar, candidates can explore IELTS Writing assessment services to receive a clearer understanding of their current writing performance and identify areas that need improvement.
Not sure whether your IELTS Writing answers meet the expected standard? Contact IFI Qatar to enquire about Writing assessment services and take a more focused approach to improving your Task 1 performance.
Build stronger comparisons, write clearer reports and prepare with greater confidence for IELTS Academic Writing.