

Currently Empty: ر.ق 0,00


IELTS
IELTS Writing Task 1 Pie Charts: How to Summarise Key Information
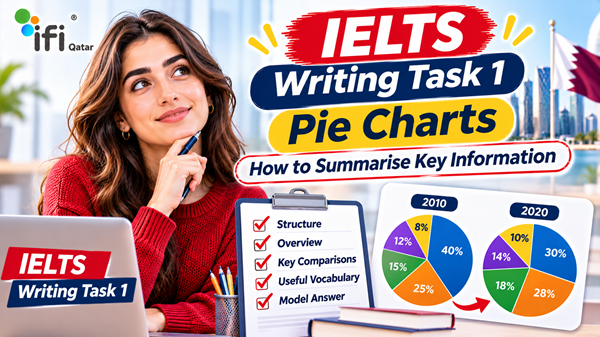
Pie charts are a common visual format in IELTS Academic Writing Task 1. They present information as percentages or proportions, allowing you to compare how different categories contribute to a total.
Although pie charts may appear straightforward, many candidates lose marks because they describe every percentage separately instead of identifying the most important features. Others struggle to compare two charts, write a clear overview or use appropriate vocabulary to describe changes and differences.
To achieve a strong IELTS Writing Task 1 response, you need to do more than report numbers. You must select relevant information, organise your comparisons logically and communicate the main features accurately.
This guide explains how to approach IELTS pie chart Task 1 questions, structure your response, compare percentages, use suitable vocabulary and avoid common mistakes. It also includes sample questions, model answers and practical exercises to help you improve your writing.
What Is an IELTS Pie Chart Task 1 Question?
An IELTS Academic Writing Task 1 pie chart question presents information in a circular chart divided into sections. Each section represents a category, and its size usually indicates the proportion or percentage of the total.
You may be asked to describe:
- One pie chart showing the distribution of a particular subject.
- Two pie charts comparing the same categories at different times.
- Multiple pie charts showing differences between groups, locations or periods.
- Changes in the proportions of different categories over time.
For example, a pie chart might show how a group of university students spend their monthly budget, including accommodation, food, transport, entertainment and other expenses.
Your task is to summarise the information by selecting and reporting the main features and making relevant comparisons where appropriate.
You are not expected to explain why the figures are the way they are or give your personal opinion.
How Long Should Your IELTS Pie Chart Task 1 Answer Be?
IELTS Academic Writing Task 1 requires you to write at least 150 words.
A practical target is approximately 160–190 words, although there is no official maximum word count.
You should also manage your time carefully. A common preparation guideline is to spend around 20 minutes on Task 1 and reserve the remaining writing time for Task 2.
Your response should include:
- An introduction that paraphrases the question.
- An overview identifying the main features.
- One or two body paragraphs presenting relevant details and comparisons.
The objective is to communicate the most important information clearly without including unnecessary descriptions.
How to Analyse an IELTS Pie Chart Before Writing
Before writing your introduction, spend a short amount of time analysing the chart.
Starting immediately without understanding the data can lead to poor comparisons, repetitive sentences and an unclear overview.
Use the following approach.
1. Identify the Main Categories
First, look at the labels and identify what the pie chart represents.
Ask yourself:
- What is being measured?
- How many categories are shown?
- What does each category represent?
- Are the figures expressed as percentages or proportions?
- Does the chart describe one group or several groups?
For example, if the chart shows household spending, the categories might include housing, food, transport, healthcare and entertainment.
Understanding the subject helps you choose accurate vocabulary when describing the information.
2. Identify the Largest and Smallest Segments
You do not need to describe every category with equal attention.
Start by identifying:
- The largest segment.
- The smallest segment.
- Any categories with similar proportions.
- Any particularly noticeable differences.
These features often provide the foundation for your overview.
For example:
| Category | Percentage |
|---|---|
| Accommodation | 40% |
| Food | 25% |
| Transport | 15% |
| Entertainment | 12% |
| Other expenses | 8% |
The main features are clear:
- Accommodation accounts for the largest proportion.
- Other expenses represent the smallest share.
- Accommodation and food together make up 65% of the total.
These are more meaningful observations than simply listing all five figures.
3. Look for Similarities and Differences
If the question contains two or more pie charts, comparison becomes especially important.
Look for:
- Categories that increase or decrease.
- Categories that remain relatively stable.
- Segments that become significantly larger or smaller.
- Categories that exchange positions.
- Differences between groups.
For example, if accommodation accounts for 35% in one year and 45% in another, you can describe an increase of 10 percentage points.
Be careful with the distinction between percentages and percentage points. An increase from 35% to 45% is a rise of 10 percentage points, not 10%.
4. Group Related Information
Grouping information makes your report easier to follow.
Instead of describing every category in isolation, organise related figures into meaningful groups.
For example:
- The two largest spending categories.
- The smaller spending categories.
- Categories that increased.
- Categories that decreased.
- Categories with relatively little change.
This approach helps you write coherent paragraphs and avoid repetitive sentence structures.
How to Structure an IELTS Pie Chart Task 1 Answer
A clear structure is essential for an effective IELTS Writing Task 1 response.
A reliable approach is to use four paragraphs.
Paragraph 1: Introduction
Your introduction should paraphrase the information in the question.
You do not need to include every figure or explain the main trends here.
For example, if the question says:
“The pie chart illustrates the percentage of household expenditure allocated to five different categories in 2025.”
You could write:
“The pie chart shows how household spending was distributed across five categories in 2025.”
The meaning remains the same, but the wording is different.
Useful ways to paraphrase include:
| Original Expression | Alternative Expression |
|---|---|
| Illustrates | Shows, presents |
| Percentage | Proportion, share |
| Household expenditure | Household spending |
| Different categories | Various areas |
| Distribution of spending | Allocation of expenses |
Avoid changing words simply to sound sophisticated. Accuracy and natural language are more important than using complicated vocabulary.
Paragraph 2: Overview
The overview is one of the most important parts of your response.
It should summarise the most noticeable features without listing every number.
For a single pie chart, you might identify the largest and smallest categories.
For two pie charts, you could highlight the most significant changes and similarities.
For example:
“Overall, accommodation represented the largest share of household expenditure, while other expenses accounted for the smallest proportion.”
This overview communicates the main features without repeating every figure.
Important: Do not confuse an overview with a conclusion. Task 1 requires a summary of the visual information, not a personal judgement or final opinion.
Paragraph 3: Body Paragraph 1
Use the first body paragraph to describe the most significant categories or a logical group of related information.
For example, you could discuss the two largest segments and compare their proportions.
Try to combine figures in meaningful sentences rather than writing one sentence for each category.
Paragraph 4: Body Paragraph 2
Use the final paragraph to describe the remaining categories, relevant similarities or additional comparisons.
Make sure that the information is accurate and that your descriptions are supported by the chart.
You do not need to include every minor detail if doing so makes your report unnecessarily long.
Essential Vocabulary for IELTS Pie Chart Task 1
Using appropriate vocabulary helps you describe proportions and comparisons more naturally.
However, memorising long lists of advanced expressions is not enough. You need to understand when each phrase is appropriate.
Vocabulary for Describing Percentages and Proportions
| Expression | Example |
|---|---|
| Account for | Housing accounted for 40% of total spending. |
| Represent | Food represented a quarter of the total. |
| Make up | Transport made up 15% of expenditure. |
| Constitute | Entertainment constituted 12% of the budget. |
| Comprise | The two largest categories comprised 65% of spending. |
| The proportion of | The proportion of spending on food was 25%. |
| The share of | The share allocated to transport was relatively small. |
| A fraction of | Other expenses represented only a small fraction of the total. |
You can use these expressions to avoid repeating “was” and “percentage” throughout your response.
Vocabulary for Comparing Categories
Comparisons are particularly important when describing multiple pie charts.
Useful expressions include:
- Higher than
- Lower than
- Greater than
- Smaller than
- Similar to
- Almost equal to
- Twice as large as
- Three times the proportion of
- The largest share
- The smallest segment
- A considerably higher proportion
- A slightly lower percentage
Examples:
“Accommodation accounted for a considerably larger proportion than transport.”
“The share allocated to entertainment was almost equal to that of healthcare.”
“Food represented twice the proportion of transport expenditure.”
Always check that your comparison matches the actual figures.
Vocabulary for Describing Increases and Decreases
When pie charts compare different years, you may need language associated with changes.
| Increase | Decrease |
|---|---|
| Increased | Decreased |
| Rose | Fell |
| Grew | Declined |
| Became larger | Became smaller |
| Saw an increase | Experienced a decline |
| Accounted for a greater share | Accounted for a smaller share |
You can also use adverbs to describe the size of a change:
- Slightly
- Gradually
- Considerably
- Significantly
- Substantially
- Marginally
For example:
“The proportion of expenditure allocated to housing increased considerably.”
“Spending on transport declined slightly over the period.”
Use these expressions only when the chart provides information about different time points or otherwise supports a change.
Useful Expressions for Fractions
Fractions can make your writing more varied when they accurately represent the figures.
| Percentage | Fraction |
|---|---|
| 10% | One tenth |
| 20% | One fifth |
| 25% | One quarter |
| 33% | Approximately one third |
| 50% | One half |
| 66% | Approximately two thirds |
| 75% | Three quarters |
For example:
“Food accounted for approximately one quarter of the total expenditure.”
Do not use an approximate fraction when the exact figure is important or when the approximation would be misleading.
IELTS Pie Chart Task 1: Sample Question and Model Answer
The following is an original practice example created to demonstrate how to describe and compare pie charts.
Sample Question
The two pie charts below show how students at a university distributed their monthly living expenses in 2020 and 2025.
Summarise the information by selecting and reporting the main features, and make comparisons where relevant.
Data for the sample pie charts:
| Expense Category | 2020 | 2025 |
|---|---|---|
| Accommodation | 35% | 40% |
| Food | 25% | 22% |
| Transport | 15% | 12% |
| Entertainment | 15% | 18% |
| Other expenses | 10% | 8% |
| Total | 100% | 100% |
Model Answer
The two pie charts compare the distribution of monthly living expenses among university students in 2020 and 2025.
Overall, accommodation accounted for the largest proportion of student expenditure in both years, while other expenses represented the smallest share. The proportion spent on accommodation and entertainment increased, whereas the figures for food, transport and other expenses declined.
In 2020, accommodation represented 35% of total monthly spending, making it the largest expense category. Food was the second-largest item, at 25%. Transport and entertainment each accounted for 15%, while the remaining 10% was allocated to other expenses.
By 2025, the share of expenditure devoted to accommodation had risen by five percentage points to 40%. Entertainment also increased, from 15% to 18%. In contrast, the proportion spent on food fell slightly to 22%, while transport declined from 15% to 12%. Other expenses experienced the smallest share in both years, decreasing from 10% to 8%.
Why Is This a Good Model Answer?
This response demonstrates several useful IELTS Writing techniques.
1. The introduction paraphrases the question.
It identifies the subject and the two years without copying the original wording.
2. The overview highlights the main features.
It identifies the largest and smallest categories and summarises which proportions increased or decreased.
3. The body paragraphs group information logically.
The first body paragraph describes the original distribution, while the second focuses on changes by 2025.
4. Comparisons are supported by figures.
The answer uses specific percentages and percentage-point changes rather than vague descriptions.
5. The language is varied but natural.
Expressions such as “accounted for”, “represented”, “rose” and “declined” help avoid repetitive wording.
Remember that a model answer is an example of an effective approach, not a text that should be memorised and reproduced in the examination.
How to Describe Two Pie Charts in IELTS Writing Task 1
Two-chart questions can be more challenging because candidates must identify both individual features and relationships between the charts.
The following strategies can help.
1. Identify What the Charts Have in Common
Before comparing differences, understand the shared subject.
For example, two charts may show:
- The same categories in different years.
- Spending patterns among two age groups.
- Energy sources in two countries.
- Employment sectors in different regions.
Identifying the relationship between the charts helps you organise your response.
2. Compare the Largest Categories
The largest segments often provide useful comparison points.
For example:
“In both years, accommodation represented the largest proportion of student expenditure, although its share was higher in 2025.”
This sentence communicates a similarity and a difference at the same time.
3. Group Categories with Similar Changes
If several categories increase while others decrease, organise them accordingly.
For example:
“While accommodation and entertainment experienced increases, the proportions allocated to food, transport and other expenses declined.”
This is more concise than describing every category in a separate sentence.
4. Use Accurate Percentage Comparisons
Pay attention to the difference between a percentage and a percentage-point change.
For example:
- 20% to 30% = an increase of 10 percentage points.
- 20% to 30% = a 50% relative increase.
In most IELTS Task 1 responses, percentage-point comparisons are straightforward and sufficient.
If you choose to calculate relative percentage changes, make sure your calculation is correct and relevant.
5. Avoid Explaining Reasons for Changes
Your job is to report the information, not speculate about the causes.
For example, if accommodation spending increases, do not write:
“This probably happened because rent became more expensive.”
Unless the chart explicitly provides that information, it is speculation.
Instead, write:
“The proportion of expenditure allocated to accommodation increased from 35% to 40%.”
Common Mistakes in IELTS Pie Chart Task 1
Many candidates understand the basic chart information but lose marks because of avoidable writing problems.
Here are some of the most common mistakes.
1. Describing Every Percentage Without an Overview
A response that lists all the figures but fails to identify the main features may lack a clear summary.
You should always include an overview that highlights the most important information.
2. Repeating the Same Vocabulary
Using “percentage”, “showed” or “accounted for” in every sentence makes your writing repetitive.
Develop a range of natural expressions, but avoid forcing synonyms into sentences where they do not fit.
3. Confusing Percentages with Percentage Points
This is a common accuracy problem when comparing two charts.
If a category increases from 15% to 25%, the difference is 10 percentage points.
Do not describe it as a 10% increase unless you are specifically referring to the relative increase.
4. Writing an Opinion or Speculating
IELTS Academic Writing Task 1 is an objective reporting task.
Avoid expressions such as:
- I believe that…
- In my opinion…
- This is probably because…
- I think people prefer…
Your answer should describe the information provided by the chart.
5. Including Irrelevant Details
Not every figure deserves the same amount of attention.
Focus on the largest, smallest and most significant differences.
If two categories have almost identical proportions, mention their similarity rather than writing several unnecessary sentences.
6. Using Incorrect Comparisons
Be careful when using expressions such as “twice as much”, “three times higher” or “the majority”.
Check the mathematical relationship before using these phrases.
For example, 40% is twice 20%, but it is not twice 30%.
7. Forgetting the Word Count
Your response must contain at least 150 words.
Writing too little may prevent you from reporting enough relevant information.
However, writing a very long answer is not automatically better. A focused response with accurate comparisons is generally more effective than a repetitive one.
8. Writing an Unclear Overview
An overview should identify the main features rather than repeat the introduction.
For example, “The charts show the percentages of different categories” is too general.
A stronger overview identifies which category dominates and what the most noticeable changes are.
How to Improve Your IELTS Pie Chart Task 1 Score
Improving your Task 1 performance requires more than memorising vocabulary.
You need to develop the ability to analyse visual information, organise comparisons and write accurately under time pressure.
1. Practise Identifying Main Features
Before writing, spend one or two minutes identifying:
- The largest category.
- The smallest category.
- Similar proportions.
- Major differences.
- Changes between years.
Practise doing this without writing complete sentences.
This helps you develop the analytical skills needed for an effective overview.
2. Build a Practical Vocabulary List
Create a vocabulary list for describing proportions, comparisons and changes.
However, do not memorise expressions without understanding their meaning.
Practise using each phrase in a sentence based on actual chart data.
3. Write Different Types of Overviews
Use a range of pie chart examples and write only the overview paragraph.
For each chart, try to identify the two or three most important features.
This is an effective way to improve your ability to select relevant information.
4. Practise Under Time Conditions
Set a 20-minute time limit for a complete Task 1 response.
A possible preparation routine is:
| Activity | Suggested Time |
|---|---|
| Analyse the chart | 2–3 minutes |
| Plan the overview and comparisons | 2 minutes |
| Write the response | 12–13 minutes |
| Check grammar and accuracy | 2–3 minutes |
These timings are a practical guideline, not an official requirement.
5. Review Your Writing Against IELTS Assessment Criteria
IELTS Academic Writing Task 1 is assessed using four criteria:
- Task Achievement: How effectively you address the task, select key features and provide an appropriate overview.
- Coherence and Cohesion: How clearly you organise information and connect ideas.
- Lexical Resource: The range, accuracy and appropriateness of your vocabulary.
- Grammatical Range and Accuracy: The variety and correctness of your grammatical structures.
Understanding these criteria helps you identify what matters when evaluating your own work.
However, assessing your own writing objectively can be difficult, especially when you are trying to determine whether your response meets the requirements of a higher band.
IELTS Pie Chart Task 1 Practice Exercise
The following exercise gives you an opportunity to apply the techniques explained in this guide.
Practice Question
The pie charts below show the percentage distribution of energy production from five sources in a country in 2010 and 2020.
Summarise the information by selecting and reporting the main features, and make comparisons where relevant.
| Energy Source | 2010 | 2020 |
|---|---|---|
| Coal | 40% | 30% |
| Natural gas | 25% | 28% |
| Nuclear | 15% | 18% |
| Hydropower | 12% | 14% |
| Other renewables | 8% | 10% |
| Total | 100% | 100% |
Your Task
Write a report of at least 150 words.
Before writing, consider these questions:
- Which energy source accounted for the largest share in both years?
- Which category experienced the biggest change?
- Which categories increased?
- Which category decreased?
- What are the most important features to include in your overview?
Suggested Planning Notes
You can use these observations to check your analysis after completing the exercise:
- Coal remained the largest source in both years.
- Coal declined from 40% to 30%.
- Natural gas increased from 25% to 28%.
- Nuclear energy rose from 15% to 18%.
- Hydropower increased from 12% to 14%.
- Other renewables grew from 8% to 10%.
Self-check: Your overview should mention the continued dominance of coal and its decline, alongside the increases in all the other categories.
Try writing your own response before looking at any model answer. This will help you identify which parts of the task you can already handle confidently.
Why Professional IELTS Writing Assessment Can Help
Practising pie charts independently is useful, but completing exercises does not always reveal why your writing is receiving a particular band estimate.
You may understand the data correctly but still have problems with:
- Selecting the most relevant features.
- Writing an effective overview.
- Organising comparisons.
- Using accurate vocabulary.
- Maintaining grammatical accuracy.
- Avoiding repetitive sentence structures.
These issues can be difficult to identify when you evaluate your own writing.
Professional IELTS Writing assessment can provide an additional perspective on your performance and help you understand which areas need improvement.
What Should a Useful Writing Assessment Include?
When choosing an IELTS Writing assessment service, look for feedback that addresses the official assessment criteria.
A useful assessment should help you understand:
Task Achievement
Whether you have identified the main features, included a clear overview and supported your descriptions with relevant data.
Coherence and Cohesion
Whether your information is organised logically and your comparisons are easy to follow.
Lexical Resource
Whether your vocabulary is varied, accurate and appropriate for describing visual information.
Grammatical Range and Accuracy
Whether your sentences demonstrate appropriate grammatical variety and accuracy.
The most useful feedback does not simply tell you that your writing needs improvement. It explains which aspects are limiting your performance and gives you a clearer direction for future practice.
Get Your IELTS Writing Assessed at IFI Qatar
Learning how to describe pie charts is an important step towards improving your IELTS Academic Writing Task 1 performance.
However, knowing the rules and applying them successfully under examination conditions are two different things.
You may be able to identify the largest and smallest segments but still struggle to produce a clear overview. You may use a wide range of vocabulary but make errors when comparing percentages. These weaknesses can be difficult to recognise without an external assessment.
At IFI Qatar, you can enquire about available IELTS Writing assessment services to better understand your current performance and identify areas that need further attention.
Whether you are preparing for Academic Writing Task 1 or working towards a specific IELTS band score, an assessment can help you make your preparation more focused.
Want to know what is holding your IELTS Writing score back? Contact IFI Qatar to enquire about Writing assessment services and get a clearer direction for your IELTS preparation.
Frequently Asked Questions About IELTS Pie Chart Task 1
How do you write an IELTS pie chart Task 1 answer?
Start by paraphrasing the question in your introduction. Then write an overview identifying the main features, followed by one or two body paragraphs describing important figures and comparisons. Focus on accuracy and avoid listing every percentage without explaining the key patterns.
How many paragraphs should I write for IELTS pie chart Task 1?
A four-paragraph structure is a practical approach: introduction, overview and two body paragraphs. However, the most important requirement is that your response clearly covers the main features and relevant comparisons.
Do I need to write an overview for IELTS pie charts?
Yes. An overview is an important part of IELTS Academic Writing Task 1. It should summarise the most noticeable features, such as the largest and smallest categories or the most significant changes between charts.
How many words should I write for IELTS Academic Writing Task 1?
You must write at least 150 words. Many candidates aim for approximately 160–190 words to provide enough detail without becoming unnecessarily repetitive.
What vocabulary should I use for IELTS pie charts?
Useful expressions include “account for”, “represent”, “make up”, “constitute”, “the largest proportion”, “the smallest share”, “increased”, “declined” and “remained relatively stable”. Choose expressions that accurately describe the information.
How do I compare two pie charts in IELTS Writing Task 1?
Identify the categories that increased, decreased or remained similar. Group related information into logical paragraphs and use accurate comparisons supported by figures. Pay attention to percentage-point differences when describing changes.
Can I use bullet points in IELTS Writing Task 1?
No. Your response should be written as a connected report using complete sentences and paragraphs. Bullet points are useful for planning, but they are not an appropriate format for your final answer.
Should I include my opinion in an IELTS pie chart report?
No. Task 1 is an objective reporting task. You should describe and compare the information shown in the chart without adding personal opinions or unsupported explanations.
What is the most common mistake in IELTS pie chart questions?
One common mistake is describing every figure without providing a meaningful overview. Other frequent problems include inaccurate comparisons, repetitive vocabulary, incorrect percentage calculations and unnecessary speculation.
Can professional feedback improve my IELTS Writing Task 1 performance?
Professional feedback can help you understand how your response performs against the IELTS assessment criteria. It can identify weaknesses in Task Achievement, organisation, vocabulary and grammar, giving you a more focused direction for further practice.