

Currently Empty: ر.ق 0,00


IELTS
IELTS Writing Task 1 Bar Chart: How to Compare Data Clearly
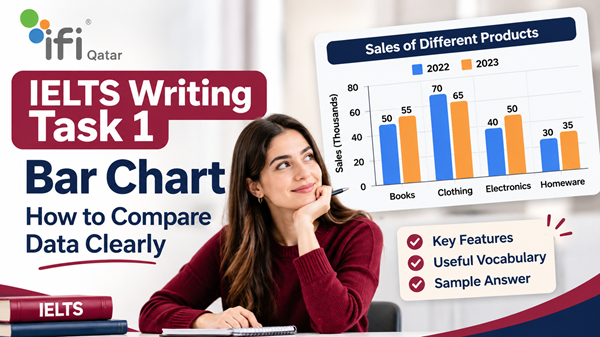
Bar charts are one of the most common visual formats in IELTS Academic Writing Task 1. They may look straightforward because the information is presented in separate bars, but describing them effectively requires more than listing figures. You need to identify the most important information, recognise similarities and differences, and organise your comparisons into a clear, logical summary.
One of the biggest challenges candidates face is deciding which figures to compare and how to explain those comparisons naturally. Some responses simply describe each bar individually, while others include too many numbers without identifying the main patterns. Both approaches can make an answer difficult to follow.
The key to a strong IELTS bar chart response is to select the most significant features and explain how the categories relate to one another.
This guide explains how to approach IELTS Writing Task 1 bar charts, write an effective overview, compare data accurately, use appropriate vocabulary and avoid common mistakes. It also includes a sample question and a model answer to help you understand how these techniques work in practice.
What Is an IELTS Writing Task 1 Bar Chart?
In IELTS Academic Writing Task 1, you may be given a bar chart showing numerical information about different categories, groups, locations or periods.
A bar chart uses rectangular bars to represent data. The height or length of each bar indicates a particular value, such as a percentage, number of people, amount of money or quantity of products.
Depending on the question, a bar chart may present:
- Information about different categories at one point in time.
- Changes in figures across several years.
- Comparisons between countries, cities or demographic groups.
- Data relating to different activities, products or services.
- Two or more related sets of information.
For example, a chart might compare the percentage of people in four countries who use public transport, or show how much money consumers spend on different products over a ten-year period.
Your task is to summarise the information in your own words, highlight the main features and make relevant comparisons. You are not expected to explain why the figures are different or give your personal opinion.
How to Analyse a Bar Chart Before Writing
Before writing your introduction, spend a short amount of time understanding the chart. A few minutes of careful analysis can prevent inaccurate comparisons and unnecessary details.
Use the following steps.
1. Identify the Chart Topic and Categories
Start by reading the chart title and question carefully. Identify what is being measured and what each bar represents.
Pay attention to:
- The subject of the chart.
- The categories being compared.
- The units of measurement.
- The countries, groups or locations involved.
- The time period, if one is provided.
For example, if a chart shows the number of international students studying in five countries in 2020, you need to recognise that the figures represent student numbers, not percentages.
Always check the vertical and horizontal axes. Misreading the measurement unit can lead to inaccurate descriptions.
2. Find the Highest and Lowest Figures
One of the easiest ways to begin comparing data is to identify the largest and smallest values.
Ask yourself:
- Which category has the highest figure?
- Which category has the lowest figure?
- Is the difference between them substantial?
- Are any other categories close to the highest or lowest value?
These details often provide useful material for your overview.
However, do not assume that the highest and lowest figures are automatically the only important features. Other patterns, such as similar results or significant gaps between groups, may be equally relevant.
3. Identify Similarities and Differences
Look beyond individual figures and consider how the categories relate to one another.
For example:
- Are two categories showing almost identical results?
- Is one group considerably higher than the others?
- Do several categories fall within a similar range?
- Is there a clear gap between the highest and lowest values?
These observations help you create meaningful comparisons rather than simply describing the bars one by one.
4. Look for Significant Changes Over Time
If the chart covers several years, identify the direction of change.
Check whether the figures:
- Increased over the period.
- Decreased gradually or sharply.
- Remained relatively stable.
- Fluctuated between years.
- Reached a peak or a low point.
You should also identify whether different categories followed similar or contrasting patterns.
For example, if spending on food increased while spending on clothing declined, this contrast may be more important than describing every annual figure separately.
How to Structure an IELTS Bar Chart Answer
A clear structure makes your response easier to read and helps you present the information logically.
A practical approach is to organise your answer into four paragraphs:
- Introduction
- Overview
- Body Paragraph 1
- Body Paragraph 2
This is a useful structure rather than a compulsory IELTS format. The most important thing is that your response covers the key features accurately and logically.
Paragraph 1: Write a Clear Introduction
Your introduction should paraphrase the information in the question.
You do not need to explain the data in detail at this stage. Simply state what the chart illustrates, including the relevant categories, location and time period.
Example question:
The bar chart below compares the percentage of people who used four different forms of transport in a city in 2010 and 2020.
Possible introduction:
The bar chart illustrates the proportions of residents who travelled using four different types of transport in a particular city in 2010 and 2020.
Notice that the introduction communicates the same information without copying the question word for word.
Useful expressions for introducing bar charts include:
- The bar chart illustrates…
- The chart compares…
- The graph presents information about…
- The figures show the proportion of…
- The chart provides a comparison of…
Avoid adding information that is not included in the original question.
Paragraph 2: Write an Effective Overview
The overview is one of the most important parts of your IELTS Academic Task 1 response.
It should summarise the most noticeable features without listing every figure.
A strong overview usually identifies two or three major observations, such as:
- The highest and lowest categories.
- The most significant difference between groups.
- A general increase or decrease.
- A category that remained relatively stable.
- A clear similarity or contrast.
Example overview:
Overall, private cars were the most commonly used form of transport in both years, while cycling remained the least popular option. The most noticeable change was the increase in public transport use, whereas car use declined over the period.
This overview is effective because it highlights the main patterns without attempting to describe every individual value.
Useful expressions include:
- Overall, it is clear that…
- The most noticeable feature is that…
- In general, …
- A key difference between the categories is that…
- It is also apparent that…
Important: Do not introduce your personal opinion, explanations or predictions in the overview. Your role is to report what the chart shows.
Paragraphs 3 and 4: Develop Your Comparisons
The body paragraphs should provide supporting details for the observations made in your overview.
Instead of describing every category in isolation, group related figures together.
For example, you might:
- Compare the two highest categories in one paragraph.
- Discuss the lower categories in another.
- Group categories that increased together.
- Compare categories that followed opposite patterns.
- Explain how the figures changed between the first and final years.
Your grouping should depend on the chart. There is no single arrangement that works for every question.
The goal is to make the information easy to understand without repeating the same comparison several times.
Essential Vocabulary for Comparing Bar Chart Data
Using accurate vocabulary can make your writing more precise and varied. However, advanced words are only useful when they describe the information correctly.
The following expressions can help you compare figures naturally.
Vocabulary for Describing High and Low Figures
| Expression | Example |
|---|---|
| The highest figure | Canada recorded the highest figure. |
| The lowest proportion | Cycling accounted for the lowest proportion. |
| The largest category | Private cars represented the largest category. |
| The smallest share | The smallest share was recorded in 2020. |
| Significantly higher | The figure for Group A was significantly higher than that for Group B. |
| Considerably lower | Spending on books was considerably lower than spending on food. |
Vocabulary for Similarities
Use these expressions when two or more categories have comparable values.
- Similarly
- Likewise
- Almost identical
- Roughly equal
- Comparable figures
- At a similar level
- Followed a similar pattern
- Showed little difference
Examples:
The figures for France and Germany were almost identical, at 42% and 44%, respectively.
Similarly, the two age groups recorded comparable levels of participation.
Vocabulary for Differences
These expressions help you highlight contrasts between categories.
- In contrast
- By comparison
- Whereas
- While
- Unlike
- Compared with
- A noticeable gap
- A considerable difference
Examples:
While the figure for private cars increased, the proportion of people using buses declined.
By comparison, spending on entertainment was considerably lower than expenditure on housing.
Vocabulary for Describing Increases and Decreases
When a bar chart presents information over time, choose verbs that accurately describe the direction and scale of change.
| Increase | Decrease |
|---|---|
| Rise | Fall |
| Increase | Decrease |
| Grow | Decline |
| Climb | Drop |
| Reach a peak | Hit a low point |
You can also use adverbs and adjectives to describe the size of a change:
- Slightly
- Gradually
- Steadily
- Sharply
- Dramatically
- Significantly
- Substantially
Examples:
The percentage of bus users rose steadily from 20% to 35%.
The number of people travelling by car fell sharply over the ten-year period.
Be careful with words such as dramatically and sharply. Use them only when the data supports a substantial change.
How to Compare Numbers Accurately
Clear comparisons depend on more than vocabulary. You also need to use numbers, percentages and approximations correctly.
1. Use Exact Figures When They Are Important
If a difference is particularly relevant, include the precise values.
For example:
The percentage of residents using buses increased from 25% in 2010 to 40% in 2020.
This sentence clearly communicates both the starting point and the final figure.
2. Use Approximation for Similar Figures
When values are close, you do not always need to repeat every exact number.
Useful expressions include:
- Approximately
- Around
- About
- Nearly
- Just over
- Just under
- Roughly
For example:
Approximately 30% of respondents preferred cycling, compared with just under one-third who chose walking.
Make sure that your approximation is mathematically reasonable. Do not describe a figure of 28% as nearly 40%.
3. Understand the Difference Between Percentage and Percentage Points
This is a common source of inaccurate reporting.
A percentage point describes the direct difference between two percentages.
For example, if a figure rises from 20% to 30%, the increase is 10 percentage points.
The relative percentage increase, however, is 50%.
For most IELTS Task 1 responses, you do not need to calculate relative percentage changes unless they are relevant to the chart. However, you should understand the distinction to avoid reporting the figures incorrectly.
4. Use Comparative Sentence Structures
Comparative grammar allows you to communicate relationships between figures efficiently.
Structure 1: Higher than
The percentage of students choosing science was higher than the proportion selecting history.
Structure 2: Lower than
The figure for online shopping was considerably lower than that for in-store purchases.
Structure 3: Whereas / While
While sales of Product A increased, sales of Product B remained stable.
Structure 4: Compared with
Compared with 2015, the number of international visitors was considerably higher in 2020.
Structure 5: Twice as high as
The figure for Group A was twice as high as that for Group B.
Use these structures naturally. A response does not need to include every type of comparative sentence to be effective.
IELTS Bar Chart Sample Question and Model Answer
The best way to understand data comparison is to see how it works in a complete response.
Sample IELTS Writing Task 1 Question
The table below presents fictional data for the percentage of students who used four different methods of transport to travel to school in 2015 and 2025.
| Method of transport | 2015 | 2025 |
|---|---|---|
| Bus | 35% | 40% |
| Car | 30% | 25% |
| Bicycle | 20% | 15% |
| Walking | 15% | 20% |
Practice task: Imagine that the information is presented as a bar chart. Summarise the information by selecting and reporting the main features, and make comparisons where relevant.
Model Answer
The bar chart compares the percentages of students who travelled to school using four different methods of transport in 2015 and 2025.
Overall, buses were the most popular means of transport in both years, while walking and cycling accounted for smaller proportions. The most notable changes were the increase in bus use and the decline in the percentages of students travelling by car and bicycle.
In 2015, buses were used by 35% of students, making them the leading form of transport. Cars ranked second, at 30%, while cycling and walking accounted for 20% and 15%, respectively. The difference between bus and car use was relatively small, at just five percentage points.
By 2025, the proportion of students travelling by bus had risen to 40%, widening its lead over the other categories. Car use, in contrast, declined by five percentage points to 25%, while the figure for cycling fell from 20% to 15%. Walking became more popular over the same period, increasing from 15% to 20%. As a result, the gap between walking and cycling widened, with walking becoming the more common option.
Why This Model Answer Works
The response demonstrates several useful techniques for IELTS bar chart questions.
1. The introduction paraphrases the task
The first paragraph identifies what the chart compares without copying the question exactly.
2. The overview highlights the main patterns
The second paragraph identifies the most popular category and summarises the main changes. It does not include every figure.
3. The body paragraphs group related information
The answer first describes the original distribution and then explains how the figures changed. This creates a logical progression.
4. Comparisons are supported by data
The response uses exact percentages and percentage-point differences to support its observations.
5. Vocabulary is varied but natural
Expressions such as accounted for, ranked second, in contrast and widening its lead help communicate the data without unnecessary repetition.
Common Mistakes to Avoid in IELTS Bar Chart Task 1
Even candidates with good English skills can lose marks when they misunderstand the task or report information inaccurately.
Here are some common problems to watch out for.
1. Describing Every Bar Without Comparing the Data
A weak response may simply list the values from left to right.
For example:
The figure for buses was 35%. Cars accounted for 30%. Cycling was 20%, and walking was 15%.
Although the information is accurate, the response does not explain the relationships between the categories.
How to improve it:
Group the figures and highlight meaningful differences.
Buses were the most popular option, at 35%, followed by cars at 30%, while cycling and walking were less common.
2. Writing an Overview Without Main Features
An overview such as “Overall, there were several differences between the categories” is too vague.
How to improve it:
Identify the most noticeable patterns. Mention the highest and lowest categories or the most significant changes where relevant.
3. Including Too Many Numbers
Reporting every figure can make your answer repetitive and difficult to follow.
How to improve it:
Select the numbers that support your main comparisons. You should provide enough detail to illustrate important features, not reproduce the entire chart in sentence form.
4. Confusing Percentages With Actual Numbers
A chart showing 40% does not necessarily represent 40 people. It represents a proportion of the total.
How to improve it:
Use the correct measurement language. If the chart presents percentages, write percentage, proportion or share. If it shows actual quantities, use number or figure where appropriate.
5. Using Inaccurate Comparison Language
Words such as double, twice, slightly and dramatically have specific meanings.
For example, a figure of 40% is twice a figure of 20%, but it is not twice as high as 30%.
How to improve it:
Check the numerical relationship before choosing a comparative expression.
6. Adding Personal Opinions or Explanations
Task 1 is a factual reporting task. You should not explain why a category became more popular unless the chart itself provides that information.
Avoid statements such as:
People probably preferred buses because they were cheaper and more convenient.
Instead, report the information shown in the chart.
7. Repeating the Same Vocabulary
Using increased, decreased and higher in every sentence can make your writing sound repetitive.
How to improve it:
Build a practical vocabulary range, but prioritise accuracy over using complicated expressions.
8. Ignoring the Overview
Some candidates move directly from the introduction to detailed figures. This makes it harder for the reader to understand the overall message.
How to improve it:
Always check that your response contains a clear summary of the most important features before presenting detailed comparisons.
How to Improve Your IELTS Bar Chart Writing
Improving your Task 1 performance requires more than memorising vocabulary. You need to develop the ability to interpret data, organise information and communicate comparisons accurately.
The following practice methods can help.
Practise Identifying Main Features Before Writing
Choose a bar chart and spend two or three minutes analysing it without writing full sentences.
Write down:
- The highest figure.
- The lowest figure.
- The most noticeable similarity.
- The biggest difference.
- Any significant changes over time.
Then decide which observations belong in your overview and which need supporting details.
This exercise helps you avoid writing before you understand the chart.
Rewrite Weak Comparisons
Take simple sentences and improve them by combining related information.
For example:
Basic version:
The figure for France was 40%. The figure for Spain was 25%.
Improved version:
France recorded a considerably higher figure than Spain, at 40% compared with 25%.
Practise creating several versions of the same comparison. This will help you develop more flexible sentence structures.
Review Your Grammar and Data Accuracy
After completing an answer, check:
- Subject-verb agreement.
- Correct use of singular and plural nouns.
- Articles and prepositions.
- Comparative and superlative structures.
- Tense consistency.
- Accurate reporting of figures.
- Correct use of percentage and percentage points.
A grammatically sophisticated sentence is not useful if it misrepresents the data.
Practise Under Time Conditions
IELTS Academic Writing Task 1 requires at least 150 words, and candidates should spend approximately 20 minutes on it.
A practical time allocation is:
| Activity | Suggested time |
|---|---|
| Analyse the chart and plan | 3 minutes |
| Write the response | 14 minutes |
| Review and correct | 3 minutes |
This is a suggested practice routine, not an official requirement. Adjust it as you become more confident, while ensuring you leave sufficient time for Writing Task 2.
Why Professional IELTS Writing Assessment Matters
You may be able to recognise the main features of a bar chart and use a range of comparison vocabulary, but that does not automatically mean your response meets the requirements of a higher IELTS band.
One of the challenges of independent preparation is recognising mistakes in your own writing. You might understand the chart correctly but fail to organise the information effectively. Alternatively, you may use advanced vocabulary while making grammatical errors or reporting figures inaccurately.
In IELTS Writing, examiners assess performance using four criteria:
- Task Achievement: How effectively you address the task, select the key features, present an overview and support your observations with accurate details.
- Coherence and Cohesion: How logically you organise information and connect your ideas.
- Lexical Resource: The range, accuracy and appropriateness of your vocabulary.
- Grammatical Range and Accuracy: The variety and accuracy of your sentence structures.
A professional Writing assessment can help you understand how your response performs across these areas.
At IFI Qatar, learners preparing for IELTS can explore Writing assessment support to identify weaknesses, understand areas for improvement and develop a more effective preparation strategy.
Rather than relying only on an estimated score, reviewing your writing with structured feedback can help you understand what needs to change in your next practice attempt.
IELTS Bar Chart Task 1: Final Checklist
Before submitting your answer in practice, use this checklist to review your work.
-
Have I accurately paraphrased the question?
-
Have I included a clear overview?
-
Have I identified the most important features?
-
Have I compared relevant categories?
-
Have I supported my comparisons with accurate figures?
-
Have I used the correct units and measurements?
-
Have I avoided personal opinions and unsupported explanations?
-
Have I organised the information into clear paragraphs?
-
Have I checked grammar, spelling and punctuation?
-
Have I written at least 150 words?
A strong response does not need to describe every detail in the chart. It needs to select the most relevant information and communicate it accurately.
Frequently Asked Questions About IELTS Bar Chart Task 1
How do you describe a bar chart in IELTS Writing Task 1?
Start by paraphrasing the question, then write an overview that identifies the main features. In the body paragraphs, group related categories and support your comparisons with relevant figures. Focus on accuracy and clear organisation rather than describing every bar separately.
How many paragraphs should I write for an IELTS bar chart?
A four-paragraph structure is a useful approach: introduction, overview and two body paragraphs. However, this is a recommended organisational method, not a compulsory IELTS rule. Your answer should remain clear, coherent and sufficiently detailed.
Do I need to write an overview in IELTS Academic Task 1?
Yes. Presenting a clear overview of the main features is an important part of Task Achievement in Academic Writing Task 1. It shows that you can identify the most significant information rather than simply listing individual figures.
How many words should I write for an IELTS bar chart?
You must write at least 150 words for IELTS Academic Writing Task 1. There is no official maximum word limit, but writing excessively can take time away from Task 2, which carries greater weight in the overall Writing score.
Should I include every number from a bar chart?
No. Select the figures that help illustrate the most important features and comparisons. Including every number can make your response unnecessarily repetitive and reduce its clarity.
What vocabulary should I use to compare bar chart data?
Useful expressions include higher than, lower than, compared with, whereas, in contrast, approximately, almost identical and accounted for. Choose expressions that accurately describe the relationship between the figures.
Can I use the same vocabulary in every IELTS bar chart answer?
You can reuse common academic expressions, but relying on the same limited vocabulary may make your writing repetitive. Develop a flexible range of expressions for describing similarities, differences, increases and decreases.
How can I improve my IELTS bar chart Task 1 score?
Practise analysing charts before writing, identifying key features, creating clear overviews and grouping related information. Review your grammar and numerical accuracy after each practice attempt. Professional feedback can also help you identify weaknesses that may be difficult to notice independently.
Is IELTS bar chart Task 1 part of Academic or General Training?
Bar charts are used in IELTS Academic Writing Task 1. In IELTS General Training, Task 1 requires candidates to write a letter instead of describing visual information.
Get Professional Feedback on Your IELTS Writing
Understanding how to compare data is an important step towards writing a stronger IELTS Academic Task 1 response. However, knowing the rules and applying them accurately under exam conditions are two different skills.
If you are preparing for IELTS in Qatar and want to understand the strengths and weaknesses of your Writing performance, consider getting your writing assessed with professional feedback.
At IFI Qatar, you can explore IELTS Writing assessment support to help identify areas for improvement and prepare more effectively for your target band score.
Take the next step in your IELTS preparation and focus on improving the skills that matter most in your Writing performance.